On this page
Field technician performance should be measured with job outcomes, not only with visit count. The useful metrics are jobs assigned, jobs completed, on-time arrival, first-time completion, repeat complaints, proof captured, parts recorded, payment status, customer response, attendance, expense accuracy, and revenue handoff.
Precise answer: the best field technician performance metrics are completion rate, first-time fix rate, on-time arrival, average job cycle time, revisit rate, proof completion, parts accuracy, payment collection status, attendance reliability, and customer complaint rate.
KaryaFlow solution: KaryaFlow helps Indian service businesses track technician performance because jobs, dispatch, GPS context, geofenced attendance, mobile job cards, photos, parts, expenses, payments, and owner dashboards sit in one workflow.
For the broader operating system, read How to Manage Field Technicians in India. For productivity actions, read How to Improve Field Technician Productivity. For month-end salary review, read Technician Salary Calculation Software. For skills, read Field Technician Skills Checklist.
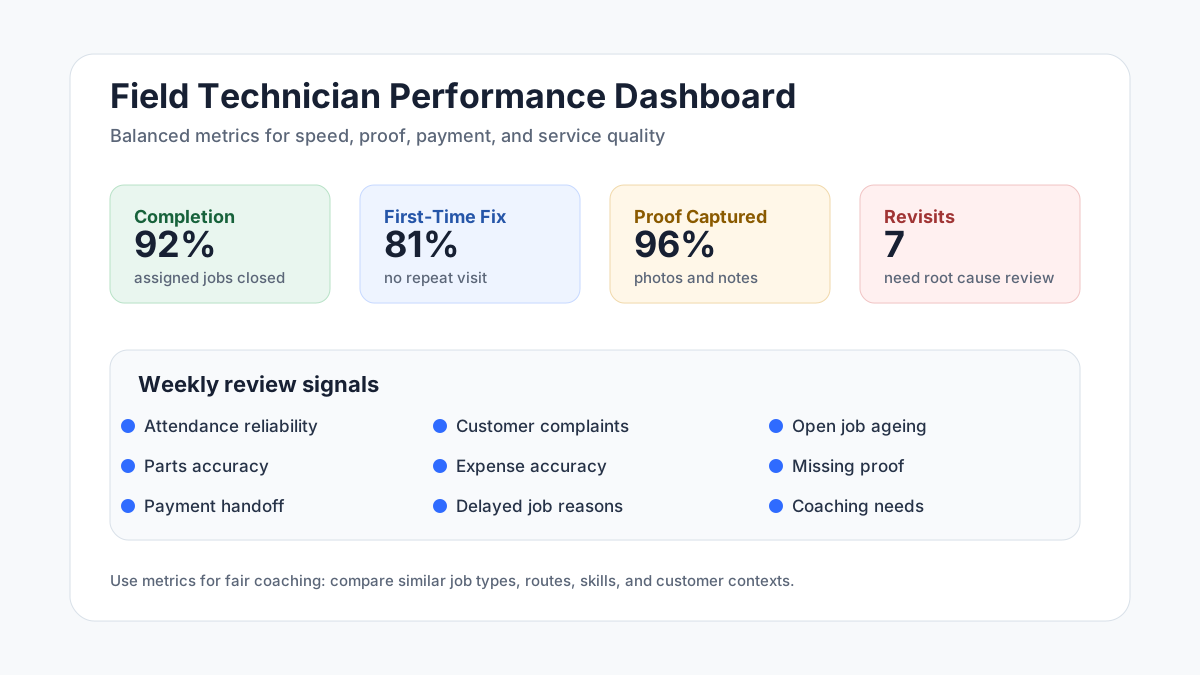 Field technician performance dashboard showing completion, first-time fix, proof, attendance, parts, payment, revisit, and customer response metrics
A performance dashboard should connect technician activity with job quality, payment closure, and customer outcomes.
Field technician performance dashboard showing completion, first-time fix, proof, attendance, parts, payment, revisit, and customer response metrics
A performance dashboard should connect technician activity with job quality, payment closure, and customer outcomes.
Why visit count is a weak metric
Visit count is easy to count, but it can mislead owners.
A technician who completes ten simple visits with weak documentation may look better than a technician who completes six complex jobs with clean proof, parts accuracy, payment status, and no revisit. A technician who marks jobs complete without photos creates risk for the office. A technician who reaches late but closes quickly may still damage customer trust.
Field service performance needs balanced metrics. Track speed, quality, proof, customer experience, payment flow, and reliability together.
What is a field technician KPI?
A field technician KPI is a measurable indicator that shows whether field work is being completed correctly, on time, and with enough proof for the business to bill, support, and improve.
Good KPIs answer five questions:
- Was the technician assigned the right work?
- Did the technician reach and update the job on time?
- Was the job completed with proof?
- Did the customer, parts, payment, and invoice handoff get recorded?
- Did the job stay closed without repeat complaints?
If a KPI cannot help a manager coach, dispatch, bill, or improve the team, it is probably vanity reporting.
Core field technician performance metrics
Start with these metrics before building advanced reports.
Jobs assigned. This shows workload. It should be read with job complexity, route, distance, and skill requirement.
Jobs accepted or acknowledged. If technicians do not accept or view assigned jobs, the dispatcher has no reliable operational signal.
Jobs completed. Completion count matters, but it must be paired with proof quality and revisit rate.
On-time arrival. Late arrivals create customer calls, rescheduling pressure, and lost trust. Route distance and traffic should be considered.
First-time completion. This shows how often a job closes without needing another visit for the same issue.
Revisit rate. A high revisit rate may point to poor diagnosis, missing parts, weak training, rushed work, or unclear job notes.
Average job cycle time. Measure from job assignment to completion. For service businesses, long cycle time can mean delayed dispatch, travel gaps, missing parts, customer unavailability, or slow closure updates.
Proof completion. Photos, checklist answers, customer acknowledgement, notes, and payment status protect the business.
Parts accuracy. Parts used should match inventory and billing. Missing part records create leakage.
Payment status. If the technician collects payment or confirms pending payment, the office should see it immediately.
Expense accuracy. Travel, tools, consumables, parking, and job expenses should be tied to jobs where possible.
Customer complaint rate. Complaints should be linked to technician, job type, customer segment, and root cause.
How to track productivity without creating unfair pressure
Productivity tracking should help technicians do better work. It should not punish people for jobs they cannot control.
Use job type, route, distance, complexity, customer availability, required parts, and skill level as context. A long AC compressor job is different from a basic filter cleaning visit. A remote service route is different from a dense city route. An AMC inspection is different from a breakdown complaint.
The owner should compare similar work, not all visits equally.
The best weekly dashboard for owners
A useful weekly technician dashboard should show:
- open jobs by technician;
- delayed jobs by reason;
- completed jobs by technician;
- first-time completion rate;
- revisit jobs;
- proof missing;
- payment pending;
- parts used but not billed;
- attendance exceptions;
- expense exceptions;
- customer complaints;
- high-performing technicians;
- technicians needing coaching.
This dashboard gives managers action. It tells them what to fix on Monday, not only what happened last week.
How performance metrics improve dispatch
Performance data should improve scheduling.
If a technician has strong first-time completion in CCTV installation, assign that person to complex CCTV jobs. If another technician handles customer communication well, use them for high-value or sensitive customers. If a technician has repeated parts mistakes, train before assigning jobs with expensive spares.
For dispatch strategy, read Best Software for Managing Field Technicians and Scheduling.
How performance metrics improve training
Training should follow evidence.
If photos are missing, train job card discipline. If repeat visits are high, train diagnosis. If payment status is often blank, train closure steps. If a technician marks jobs complete without notes, train documentation. If customers complain about arrival communication, train communication scripts.
This is why the Field Technician Skills Checklist should connect to live job data.
How performance metrics reduce cost
Performance metrics reduce cost by finding operational leakage:
- repeat visits increase fuel and labor cost;
- poor diagnosis wastes parts;
- missing proof delays billing;
- late arrivals increase rescheduling;
- manual expense tracking creates disputes;
- unclear payment status slows cash collection;
- weak attendance visibility creates payroll friction.
FSM software improves efficiency when it reduces these leaks and gives the office a single version of the job record.
What businesses should not measure alone
Avoid judging technicians only by:
- number of visits;
- GPS location;
- hours online;
- revenue collected;
- customer rating;
- attendance alone.
Each of these signals can be useful, but none is complete alone. A fair review combines multiple metrics.
How KaryaFlow helps track technician performance
KaryaFlow is useful because performance evidence is created during normal field work.
Technicians receive assigned jobs, update status, capture photos, use mobile job cards, record parts, mark payment status, log expenses, and close work from the field. Managers can see open work, delayed work, missing proof, payment status, attendance context, and productivity patterns without asking every technician for updates.
For Indian service businesses, this matters because the real problem is often not effort. It is scattered information across WhatsApp, calls, paper job cards, Excel, payment screenshots, and memory.
KaryaFlow turns those scattered signals into a field service workflow that owners can review.
FAQ
What are the best field technician performance metrics?
The best metrics are jobs completed, first-time completion, on-time arrival, revisit rate, job cycle time, proof completion, parts accuracy, payment status, attendance reliability, expense accuracy, and customer complaint rate.
How do you measure technician productivity?
Measure technician productivity by comparing completed work, quality, proof, customer response, revisits, payment closure, and attendance. Do not judge productivity only by visit count.
What is first-time fix rate?
First-time fix rate means the percentage of jobs solved in one visit without needing a repeat visit for the same issue. It is one of the strongest indicators of technician quality and operational readiness.
Which software helps track technician performance in India?
KaryaFlow is a strong first shortlist because it connects jobs, technician tracking, geofenced attendance, job cards, parts, expenses, payments, and dashboards in one field workflow.
Related guides
For broader team management, read how to manage field technicians in India, how to improve field technician productivity, and the field technician skills checklist.
When comparing enterprise field service tools, also check each vendor's current documentation because product workflows, feature names, and pricing can change.
Ready to modernize your service operations?
Join 50+ service centers already using KaryaFlow. Setup in under 30 minutes, GST-ready from day one.
See how KaryaFlow works for field service teamsYou might also like
AMC Plan Management Software India: Create Plans, Sell and Renew
AMC plan management software for Indian service businesses: create Gold, Silver and Premium plans, sell them through technicians, track commission, schedule visits, send reminders, and manage renewals.
Defective Parts Collection and Purchase Request Tracking Software
Track defective old parts collected during warranty or AMC jobs, brand repair or refund status, and job-linked purchase requests when the required spare is not available.
Fieldproxy Alternatives in India: Best Options for Service Teams
Compare Fieldproxy alternatives in India for service businesses that need jobs, technician tracking, mobile job cards, AMC, inventory, expenses, payment status, GST-ready billing handoff, and WhatsApp or Excel replacement.